Tarek Nageh

Explore My Work Download CV

About Me

Tarek Nageh - Data Analyst and Power BI Expert

Passionate Professional

I'm Tarek Nageh, a data analyst and designer with extensive experience crafting interactive dashboards and digital experiences. My work spans analytics and visualization, helping businesses make data-driven decisions through compelling visual stories.

Data Analysis Power BI / Fabric SQL Server Python Excel Dashboard Design Data Visualization ETL Processes

Featured Projects

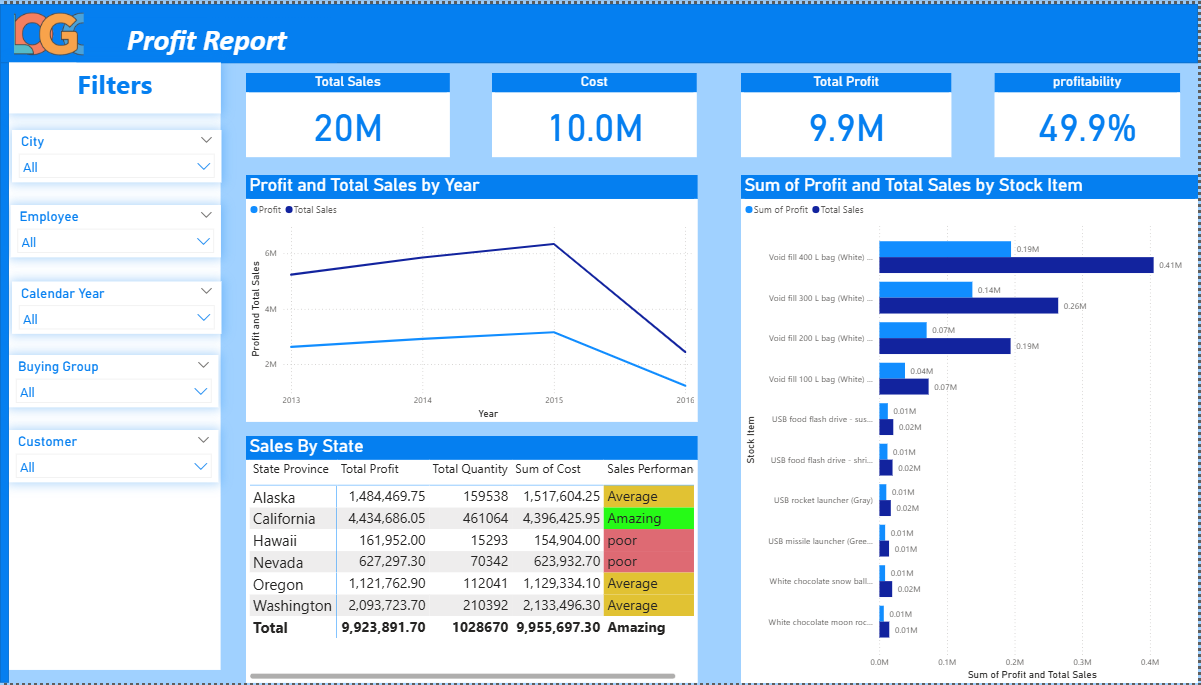
Sales Performance Dashboard showing quarterly analysis
Power BI

Sales Performance Dashboard

Case Study: Advanced Sales Performance Analysis (QoQ). This Power BI Dashboard was designed for executive decision-making, integrating data from multiple sources to track 9.9M Total Profit from 20M Total Sales, achieving 49.9% profitability.

The data analysis highlighted significant performance variance across regions and a sharp sales drop in 2016 following a 2015 peak. I utilized DAX functions to create dynamic time-intelligence calculations (like Quarter-over-Quarter) and implemented interactive data visualization techniques to allow managers to instantly filter sales trends, identify low-performing states, and strategize for future growth. This comprehensive Sales Analysis Dashboard turns raw transaction data into clear, actionable insights for executive teams.

HR Analytics Dashboard showing workforce metrics
Power BI

HR Analytics Dashboard

Case Study: HR Workforce Analysis and Headcount Planning. This Power BI Dashboard provides a detailed overview of the organization's Human Resources data, covering 689 employees and a total salary of 1.4M.

The data analysis focuses on departmental distribution (Manufacturing is largest), gender ratios (mostly male, 65%), and geographical distribution (Main center has the largest headcount of 251). I employed advanced filtering and data visualization to highlight the peak headcount period in 2019, enabling HR leaders to better understand employee trends, plan recruitment strategies, and manage compensation and workforce efficiency effectively. The dashboard includes interactive slicers for dynamic filtering by department, location, and time period.

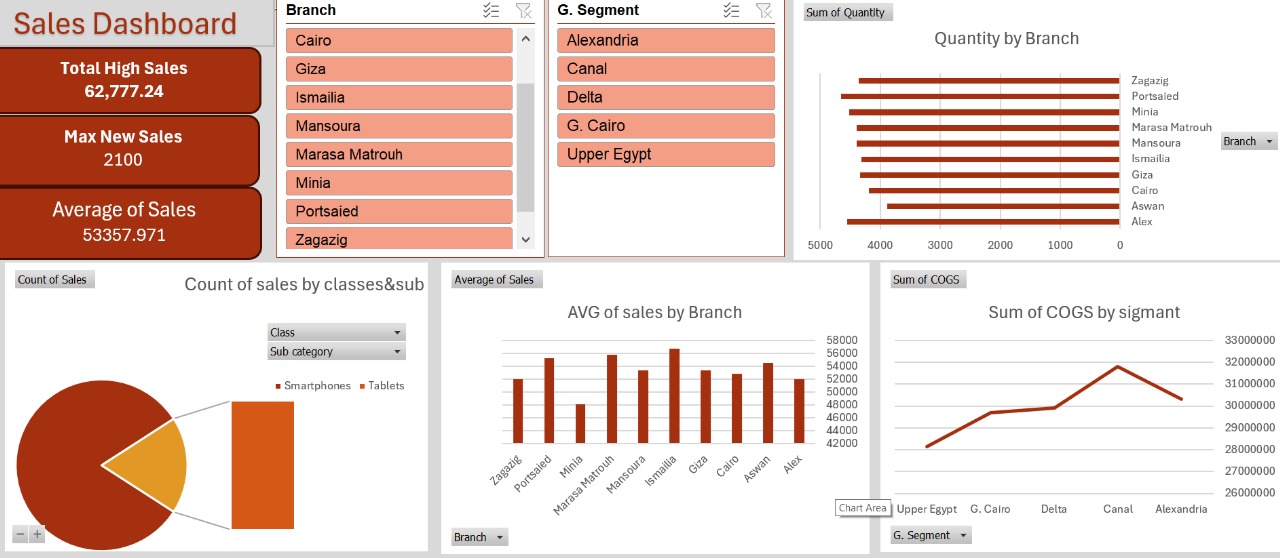
Excel Sales Tracker Dashboard
Excel

Excel Sales Tracker

Case Study: Comprehensive Sales and Profitability Tracking for Retail. This advanced Excel Dashboard offers a dynamic view of sales metrics, profit margins, and detailed geographical/product distribution across various Egyptian branches.

The analysis integrates Sales, Profit, and Detailed Item Metrics across three interconnected dashboards (Sales, Profit, and Details). Key features include: tracking high sales ($62.7K), maximum profit ($3.1K), dynamic filters by Branch and Geographic Segment, and a deep-dive table showing profitability by product category (Smartphones/Tablets) in each branch. The use of Excel's power features including Pivot Tables, Power Query, and advanced formulas ensures real-time, actionable insights for strategic decision-making and performance monitoring.

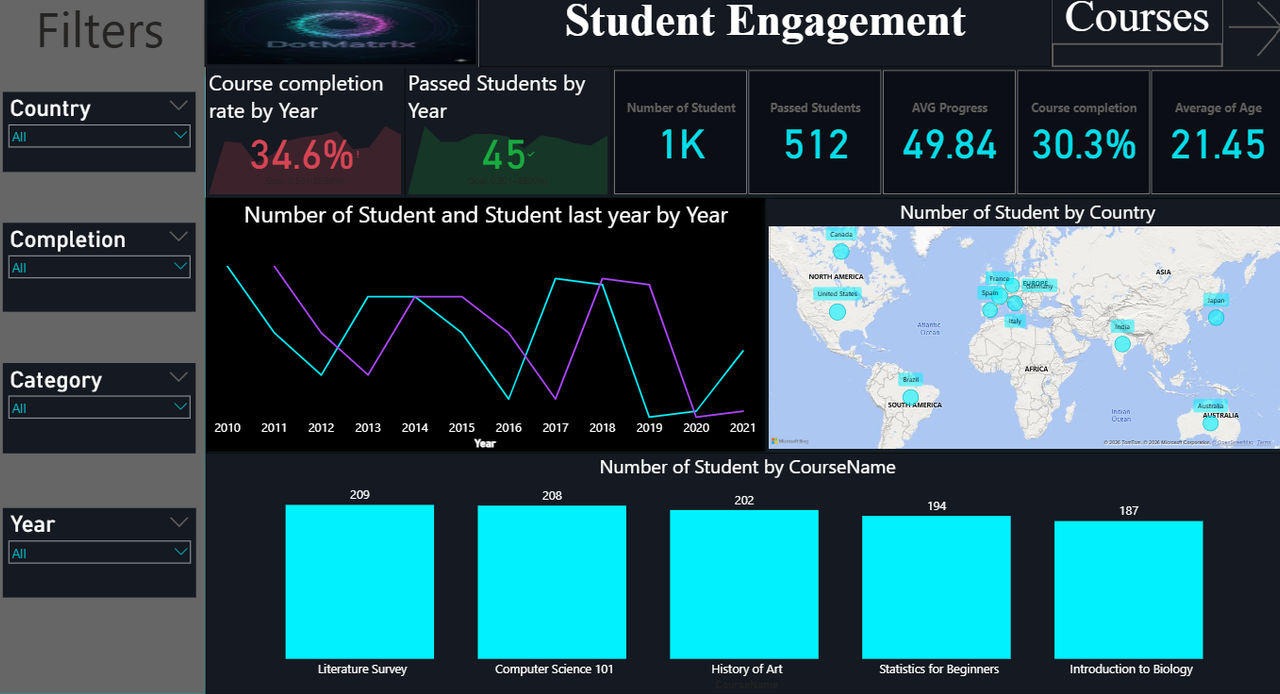
Platforms Performance Dashboard for student analytics
Power BI

Platforms Performance

Case Study: Comprehensive analysis of 1,000+ students across 10 countries and 303 courses. This Power BI Dashboard tracks student engagement metrics with 34.6% course completion rate and 49.84% average progress.

The dashboard analyzes 512 passed students with detailed breakdowns by 5 major courses: Literature Survey (209 students), Computer Science 101 (208), History of Art (202), Statistics for Beginners (194), and Introduction to Biology (187). Category analysis reveals Fiction leads with 231 students (23.1%), followed by Science Fiction 206 (20.6%), Mystery 202 (20.2%), Romance 183 (18.3%), and Non-fiction 178 (17.8%). Geographic distribution covers USA, Canada, Brazil, UK, France, Germany, Spain, Italy, India, Japan, and Australia. The system tracks 2.50 average rating with YOY growth analysis from 2010-2021.

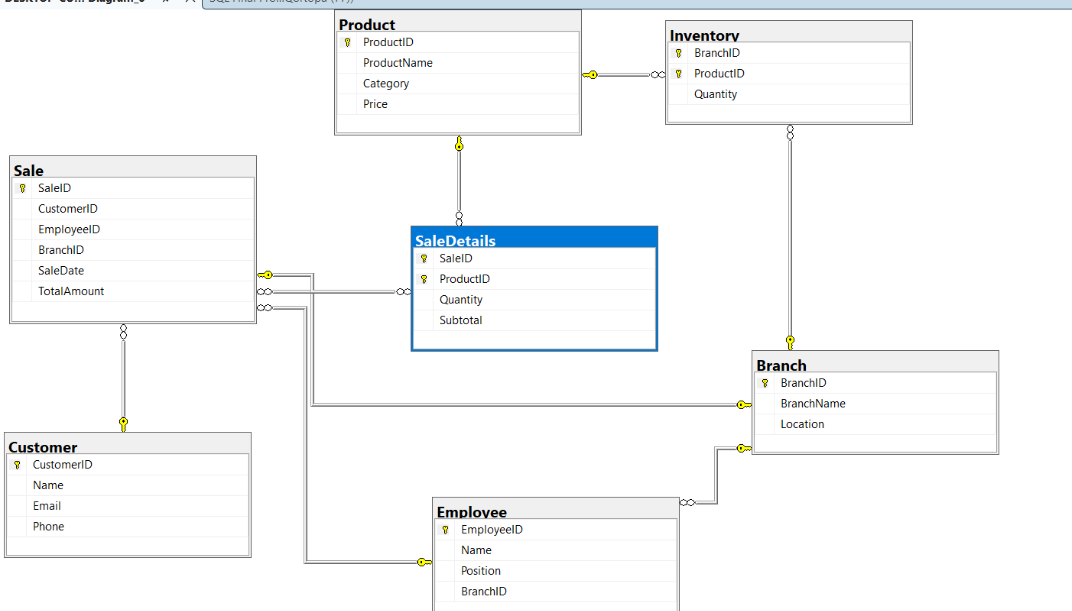
SQL Retail Sales Analysis project
SQL

SQL Retail Sales Analysis

Case Study: Comprehensive SQL-based analysis of retail sales data focusing on revenue trends, customer behavior, and product performance using advanced querying techniques.

Developed comprehensive SQL queries to analyze retail sales data, focusing on revenue trends, customer behavior, and product performance. Created complex joins, aggregations, and window functions to derive actionable insights from transactional data. Implemented data cleaning and transformation techniques to ensure data quality and consistency. Generated key performance indicators (KPIs) including monthly sales growth, customer retention rates, and product category rankings. The project demonstrates proficiency in SQL Server, MySQL, and database optimization techniques for large-scale data analysis.

Get In Touch

Let's Create Something Amazing

Ready to bring your vision to life? Contact me to discuss your project and how we can work together to transform your data into actionable insights.

Tareknageh343@gmail.com
+20 1060440658
Cairo, Egypt